> ## Documentation Index
> Fetch the complete documentation index at: https://private-7c7dfe99-postgresql-tls-support.mintlify.site/llms.txt
> Use this file to discover all available pages before exploring further.

> Mitzu is a no-code warehouse-native product analytics application.

# Connecting Mitzu to ClickHouse

export const CommunityMaintainedBadge = () => {
  return <div className="CommunityMaintainedBadge">
            <div className="CommunityMaintainedIcon">
            <svg xmlns="http://www.w3.org/2000/svg" width="20" height="20" fill="currentColor" viewBox="0 0 256 256">
                <path d="M244.8,150.4a8,8,0,0,1-11.2-1.6A51.6,51.6,0,0,0,192,128a8,8,0,0,1-7.37-4.89,8,8,0,0,1,0-6.22A8,8,0,0,1,192,112a24,24,0,1,0-23.24-30,8,8,0,1,1-15.5-4A40,40,0,1,1,219,117.51a67.94,67.94,0,0,1,27.43,21.68A8,8,0,0,1,244.8,150.4ZM190.92,212a8,8,0,1,1-13.84,8,57,57,0,0,0-98.16,0,8,8,0,1,1-13.84-8,72.06,72.06,0,0,1,33.74-29.92,48,48,0,1,1,58.36,0A72.06,72.06,0,0,1,190.92,212ZM128,176a32,32,0,1,0-32-32A32,32,0,0,0,128,176ZM72,120a8,8,0,0,0-8-8A24,24,0,1,1,87.24,82a8,8,0,1,0,15.5-4A40,40,0,1,0,37,117.51,67.94,67.94,0,0,0,9.6,139.19a8,8,0,1,0,12.8,9.61A51.6,51.6,0,0,1,64,128,8,8,0,0,0,72,120Z"></path>
            </svg>
        </div>
            Community Maintained
        </div>;
};

export const Image = ({img, alt, size = "lg"}) => {
  const normalizedSize = ["sm", "md", "lg"].includes(size) ? size : "lg";
  return <div className={`ch-image-${normalizedSize}`}>
      <Frame>
        <img src={img} alt={alt} />
      </Frame>
    </div>;
};

Mitzu is a no-code, warehouse-native product analytics application. Similar to tools like Amplitude, Mixpanel, and PostHog, Mitzu empowers users to analyze product usage data without requiring SQL or Python expertise.

However, unlike these platforms, Mitzu doesn't duplicate the company's product usage data. Instead, it generates native SQL queries directly on the company's existing data warehouse or lake.

<h2 id="goal">
  Goal
</h2>

In this guide, we're going to cover the following:

* Warehouse-native product analytics
* How to integrate Mitzu to ClickHouse

<Tip>
  **Example datasets**

  If you don't have a data set to use for Mitzu, you can work with NYC Taxi Data.
  This dataset is available in ClickHouse Cloud or [can be loaded with these instructions](/get-started/sample-datasets/nyc-taxi).
</Tip>

This guide is just a brief overview of how to use Mitzu. You can find more detailed information in the [Mitzu documentation](https://docs.mitzu.io/).

<Steps>
  <Step title="Gather your connection details" id="1-gather-your-connection-details">
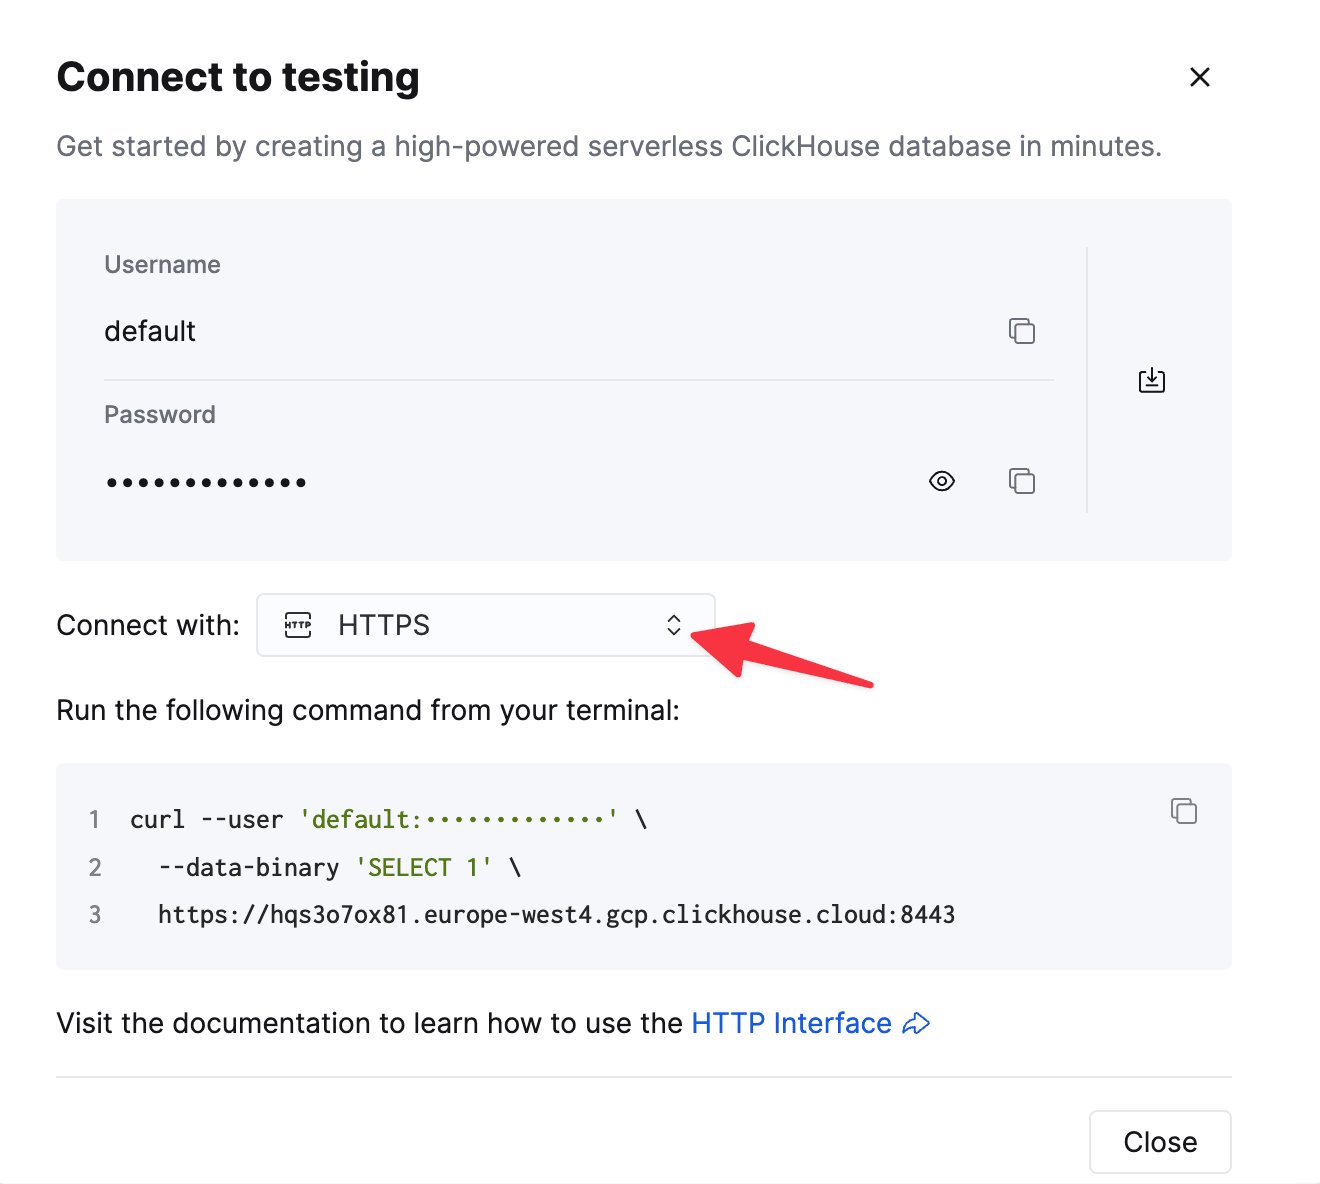
    To connect to ClickHouse with HTTP(S) you need this information:

    | Parameter(s)              | Description                                                                                                    |
    | ------------------------- | -------------------------------------------------------------------------------------------------------------- |
    | `HOST` and `PORT`         | Typically, the port is 8443 when using TLS or 8123 when not using TLS.                                         |
    | `DATABASE NAME`           | Out of the box, there is a database named `default`, use the name of the database that you want to connect to. |
    | `USERNAME` and `PASSWORD` | Out of the box, the username is `default`. Use the username appropriate for your use case.                     |

    The details for your ClickHouse Cloud service are available in the ClickHouse Cloud console.
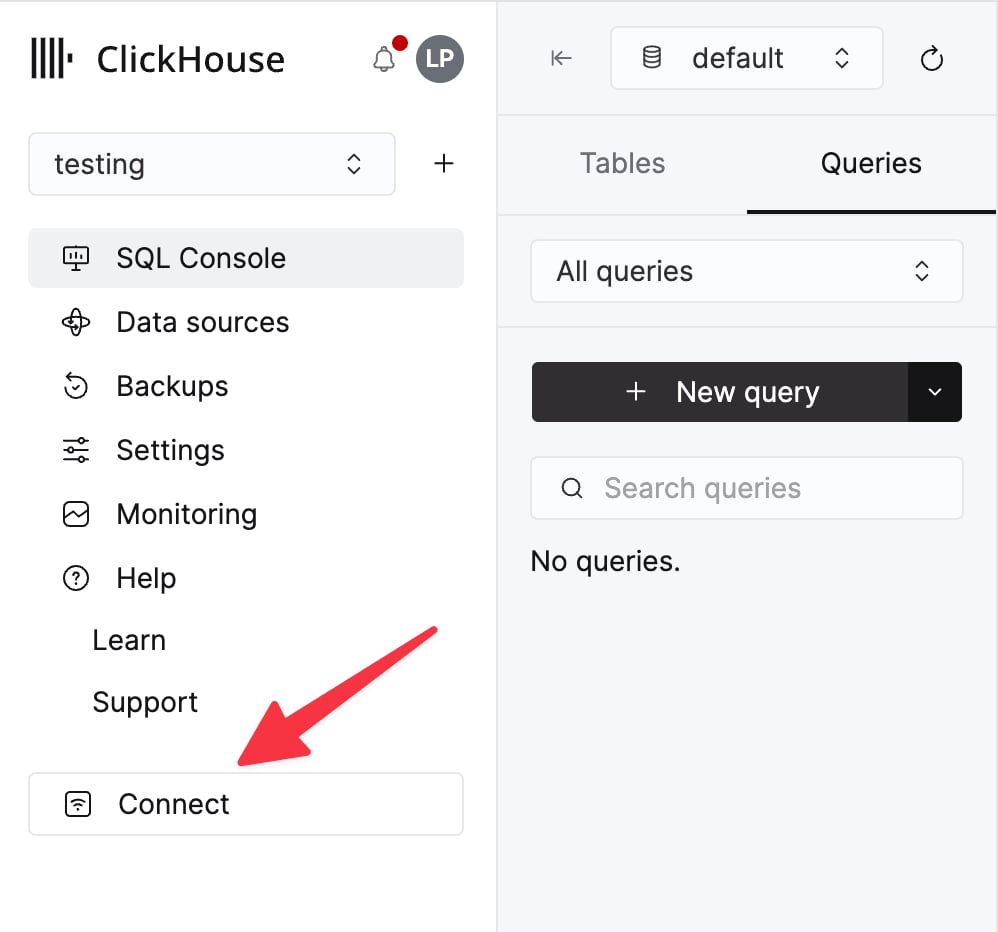
    Select a service and click **Connect**:

    <div className="ch-image-md">
      <Frame>
        <img src="https://mintcdn.com/private-7c7dfe99-postgresql-tls-support/cTIaEq6k6KYDgBI1/images/_snippets/cloud-connect-button.webp?fit=max&auto=format&n=cTIaEq6k6KYDgBI1&q=85&s=dd441fc2272e292760011d48e81d43d4" alt="ClickHouse Cloud service connect button" width="998" height="932" data-path="images/_snippets/cloud-connect-button.webp" />
      </Frame>
    </div>

    Choose **HTTPS**. Connection details are displayed in an example `curl` command.

    <div className="ch-image-md">
      <Frame>
        <img src="https://mintcdn.com/private-7c7dfe99-postgresql-tls-support/cTIaEq6k6KYDgBI1/images/_snippets/connection-details-https.webp?fit=max&auto=format&n=cTIaEq6k6KYDgBI1&q=85&s=878b1fe94ea520377426f69503e38994" alt="ClickHouse Cloud HTTPS connection details" width="1320" height="1184" data-path="images/_snippets/connection-details-https.webp" />
      </Frame>
    </div>

    If you're using self-managed ClickHouse, the connection details are set by your ClickHouse administrator.
  </Step>

  <Step title="Sign in or sign up to Mitzu" id="2-sign-in-or-sign-up-to-mitzu">
    As a first step, head to [https://app.mitzu.io](https://app.mitzu.io) to sign up.

    <Image size="lg" img="https://mintcdn.com/private-7c7dfe99-postgresql-tls-support/sK1EDai1DhVYGATV/images/integrations/data-visualization/mitzu_01.webp?fit=max&auto=format&n=sK1EDai1DhVYGATV&q=85&s=0cff21a5d3627139b41754323f2512cb" alt="Mitzu sign-in page with email and password fields" border width="1913" height="962" data-path="images/integrations/data-visualization/mitzu_01.webp" />
  </Step>

  <Step title="Configure your workspace" id="3-configure-your-workspace">
    After creating an organization, follow the `Set up your workspace` onboarding guide in the left sidebar. Then, click on the `Connect Mitzu with your data warehouse` link.

    <Image size="lg" img="https://mintcdn.com/private-7c7dfe99-postgresql-tls-support/sK1EDai1DhVYGATV/images/integrations/data-visualization/mitzu_02.webp?fit=max&auto=format&n=sK1EDai1DhVYGATV&q=85&s=9d1a3a052e4d07c6935d699334fcabbb" alt="Mitzu workspace setup page showing onboarding steps" border width="1919" height="967" data-path="images/integrations/data-visualization/mitzu_02.webp" />
  </Step>

  <Step title="Connect Mitzu to ClickHouse" id="4-connect-mitzu-to-clickhouse">
    First, select ClickHouse as the connection type and set the connection details. Then, click the `Test connection & Save` button to save the settings.

    <Image size="lg" img="https://mintcdn.com/private-7c7dfe99-postgresql-tls-support/sK1EDai1DhVYGATV/images/integrations/data-visualization/mitzu_03.webp?fit=max&auto=format&n=sK1EDai1DhVYGATV&q=85&s=823b92ee6948a0069726ad5beb148a38" alt="Mitzu connection setup page for ClickHouse with configuration form" border width="1323" height="850" data-path="images/integrations/data-visualization/mitzu_03.webp" />
  </Step>

  <Step title="Configure event tables" id="5-configure-event-tables">
    Once the connection is saved, select the `Event tables` tab and click the `Add table` button. In the modal, select your database and the tables you want to add to Mitzu.

    Use the checkboxes to select at least one table and click on the `Configure table` button. This will open a modal window where you can set the key columns for each table.

    <Image size="lg" img="https://mintcdn.com/private-7c7dfe99-postgresql-tls-support/sK1EDai1DhVYGATV/images/integrations/data-visualization/mitzu_04.webp?fit=max&auto=format&n=sK1EDai1DhVYGATV&q=85&s=ca526fdf470095c4a14fcaf1403aeb15" alt="Mitzu table selection interface showing database tables" border width="1341" height="885" data-path="images/integrations/data-visualization/mitzu_04.webp" />

    <br />

    > To run product analytics on your ClickHouse setup, you need to > specify a few key columns from your table.
    >
    > These are the following:
    >
    > * **User id** - the column for the unique identifier for the users.
    > * **Event time** - the timestamp column of your events.
    > * Optional\[**Event name**] - This column segments the events if the table contains multiple event types.

    <Image size="lg" img="https://mintcdn.com/private-7c7dfe99-postgresql-tls-support/sK1EDai1DhVYGATV/images/integrations/data-visualization/mitzu_05.webp?fit=max&auto=format&n=sK1EDai1DhVYGATV&q=85&s=5a26e68db25110015e65ba4ab6eb2d33" alt="Mitzu event catalog configuration showing column mapping options" border width="1611" height="693" data-path="images/integrations/data-visualization/mitzu_05.webp" />

    <br />

    Once all tables are configured, click on the `Save & update event catalog` button, and  Mitzu will find all events and their properties from the above-defined table. This step may take up to a few minutes, depending on the size of your dataset.
  </Step>

  <Step title="Run segmentation queries" id="4-run-segmentation-queries">
    User segmentation in Mitzu is as easy as in Amplitude, Mixpanel, or PostHog.

    The Explore page has a left-hand selection area for events, while the top section allows you to configure the time horizon.

    <Image size="lg" img="https://mintcdn.com/private-7c7dfe99-postgresql-tls-support/sK1EDai1DhVYGATV/images/integrations/data-visualization/mitzu_06.webp?fit=max&auto=format&n=sK1EDai1DhVYGATV&q=85&s=5b455399fe06f7b12bc468872b44d34b" alt="Mitzu segmentation query interface with event selection and time configuration" border width="1634" height="873" data-path="images/integrations/data-visualization/mitzu_06.webp" />

    <br />

    <Tip>
      **Filters and Breakdown**

      Filtering is done as you would expect: pick a property (ClickHouse column) and select the values from the dropdown that you want to filter.
      You can choose any event or user property for breakdowns (see below for how to integrate user properties).
    </Tip>
  </Step>

  <Step title="Run funnel queries" id="5-run-funnel-queries">
    Select up to 9 steps for a funnel. Choose the time window within which your users can complete the funnel.
    Get immediate conversion rate insights without writing a single line of SQL code.

    <Image size="lg" img="https://mintcdn.com/private-7c7dfe99-postgresql-tls-support/sK1EDai1DhVYGATV/images/integrations/data-visualization/mitzu_07.webp?fit=max&auto=format&n=sK1EDai1DhVYGATV&q=85&s=4fe4d8c2fd42f4aec3c0587d3b5d1a1b" alt="Mitzu funnel analysis view showing conversion rates between steps" border width="1630" height="880" data-path="images/integrations/data-visualization/mitzu_07.webp" />

    <br />

    <Tip>
      **Visualize trends**

      Pick `Funnel trends` to visualize funnel trends over time.
    </Tip>
  </Step>

  <Step title="Run retention queries" id="6-run-retention-queries">
    Select up to 2 steps for a retention rate calculation. Choose the retention window for the recurring window for
    Get immediate conversion rate insights without writing a single line of SQL code.

    <Image size="lg" img="https://mintcdn.com/private-7c7dfe99-postgresql-tls-support/sK1EDai1DhVYGATV/images/integrations/data-visualization/mitzu_08.webp?fit=max&auto=format&n=sK1EDai1DhVYGATV&q=85&s=c5410abec66ff9bdff8cc9941d289df0" alt="Mitzu retention analysis showing cohort retention rates" border width="1634" height="828" data-path="images/integrations/data-visualization/mitzu_08.webp" />

    <br />

    <Tip>
      **Cohort retention**

      Pick `Weekly cohort retention` to visualize how your retention rates change over time.
    </Tip>
  </Step>

  <Step title="Run journey queries" id="7-run-journey-queries">
    Select up to 9 steps for a funnel. Choose the time window within which your users can finish the journey. The Mitzu journey chart gives you a visual map of every path users take through the selected events.

    <Image size="lg" img="https://mintcdn.com/private-7c7dfe99-postgresql-tls-support/sK1EDai1DhVYGATV/images/integrations/data-visualization/mitzu_09.webp?fit=max&auto=format&n=sK1EDai1DhVYGATV&q=85&s=ed182bb15f1b2dec91f978e41178af9d" alt="Mitzu journey visualization showing user path flow between events" border width="1630" height="885" data-path="images/integrations/data-visualization/mitzu_09.webp" />

    <br />

    <Tip>
      **Break down steps**

      You can select a property for the segment `Break down` to distinguish users within the same step.
    </Tip>

    <br />
  </Step>

  <Step title="Run revenue queries" id="8-run-revenue-queries">
    If revenue settings are configured, Mitzu can calculate the total MRR and subscription count based on your payment events.

    <Image size="lg" img="https://mintcdn.com/private-7c7dfe99-postgresql-tls-support/sK1EDai1DhVYGATV/images/integrations/data-visualization/mitzu_10.webp?fit=max&auto=format&n=sK1EDai1DhVYGATV&q=85&s=fa704b1d8c079a47b58044c3345b341d" alt="Mitzu revenue analysis dashboard showing MRR metrics" border width="1634" height="820" data-path="images/integrations/data-visualization/mitzu_10.webp" />
  </Step>

  <Step title="SQL native" id="9-sql-native">
    Mitzu is SQL Native, which means it generates native SQL code from your chosen configuration on the Explore page.

    <Image size="lg" img="https://mintcdn.com/private-7c7dfe99-postgresql-tls-support/sK1EDai1DhVYGATV/images/integrations/data-visualization/mitzu_11.webp?fit=max&auto=format&n=sK1EDai1DhVYGATV&q=85&s=48a3aff465608f30bb9a8f58d530af78" alt="Mitzu SQL code generation view showing native ClickHouse query" border width="3814" height="1854" data-path="images/integrations/data-visualization/mitzu_11.webp" />

    <br />

    <Tip>
      **Continue your work in a BI tool**

      If you encounter a limitation with Mitzu UI, copy the SQL code and continue your work in a BI tool.
    </Tip>
  </Step>
</Steps>

<h2 id="mitzu-support">
  Mitzu support
</h2>

If you're lost, feel free to contact us at [support@mitzu.io](email://support@mitzu.io)

Or you our Slack community [here](https://join.slack.com/t/mitzu-io/shared_invite/zt-1h1ykr93a-_VtVu0XshfspFjOg6sczKg)

<h2 id="learn-more">
  Learn more
</h2>

Find more information about Mitzu at [mitzu.io](https://mitzu.io)

Visit our documentation page at [docs.mitzu.io](https://docs.mitzu.io)